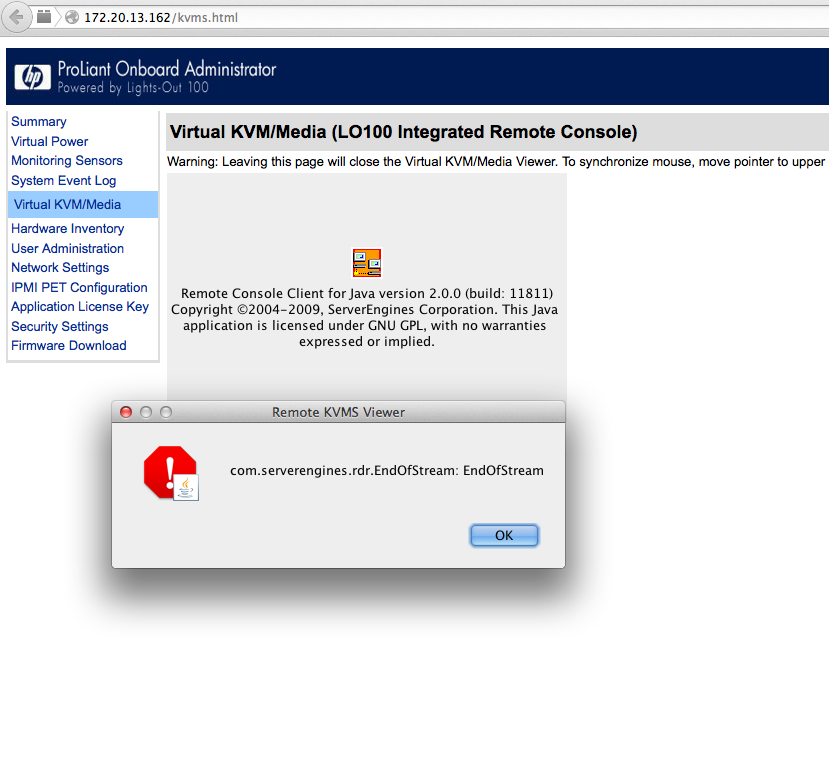
Fastest way around this is to point your browser to: IP_ADDRESS/M2.JAR and download jar to your computer.

It should connect without problems now.
imac-sebcia:CaptureboxApp sebcio$ python boot_darwin.py
2014-09-13 00:07:59.795 Python[2130:d07] __main__(): running in --debug mode
2014-09-12 23:27:46.749 Python[1746:d07] buildLatestScreensMenu(): end
Segmentation fault: 11
ulimit -c unlimited
imac-sebcia:CaptureboxApp sebcio$ python boot_darwin.py
2014-09-13 00:07:59.795 Python[2130:d07] __main__(): running in --debug mode
2014-09-12 23:27:46.749 Python[1746:d07] buildLatestScreensMenu(): end
Segmentation fault: 11 (core dumped)
imac-sebcia:~ sebcio$ ls -la /cores
total 3461280
drwxrwxr-t@  3 root    admin         102 13 wrz 00:08 .
drwxr-xr-x  34 root    wheel        1224 12 wrz 19:42 ..
-r--------   1 sebcio  admin  1772175360 13 wrz 00:09 core.2132
imac-sebcia:cores sebcio$ lldb -c core.2132
Core file '/cores/core.2132' (x86_64) was loaded.
Process 0 stopped
* thread #1: tid = 0x0000, 0x00007fff89cca097 libobjc.A.dylib`objc_msgSend + 23, stop reason = signal SIGSTOP
    frame #0: 0x00007fff89cca097 libobjc.A.dylib`objc_msgSend + 23
libobjc.A.dylib`objc_msgSend + 23:
-> 0x7fff89cca097:  andl   0x18(%r11), %r10d
   0x7fff89cca09b:  shlq   $0x4, %r10
   0x7fff89cca09f:  addq   0x10(%r11), %r10
   0x7fff89cca0a3:  cmpq   (%r10), %rsi
  thread #2: tid = 0x0001, 0x00007fff8e8d0662 libsystem_kernel.dylib`kevent64 + 10, stop reason = signal SIGSTOP
    frame #0: 0x00007fff8e8d0662 libsystem_kernel.dylib`kevent64 + 10
libsystem_kernel.dylib`kevent64 + 10:
-> 0x7fff8e8d0662:  jae    0x7fff8e8d066c            ; kevent64 + 20
   0x7fff8e8d0664:  movq   %rax, %rdi
   0x7fff8e8d0667:  jmpq   0x7fff8e8cc175            ; cerror_nocancel
   0x7fff8e8d066c:  ret
  thread #3: tid = 0x0002, 0x00007fff8e8cfe6a libsystem_kernel.dylib`__work

....